Examples
Here are a few examples of what you can do with the app:
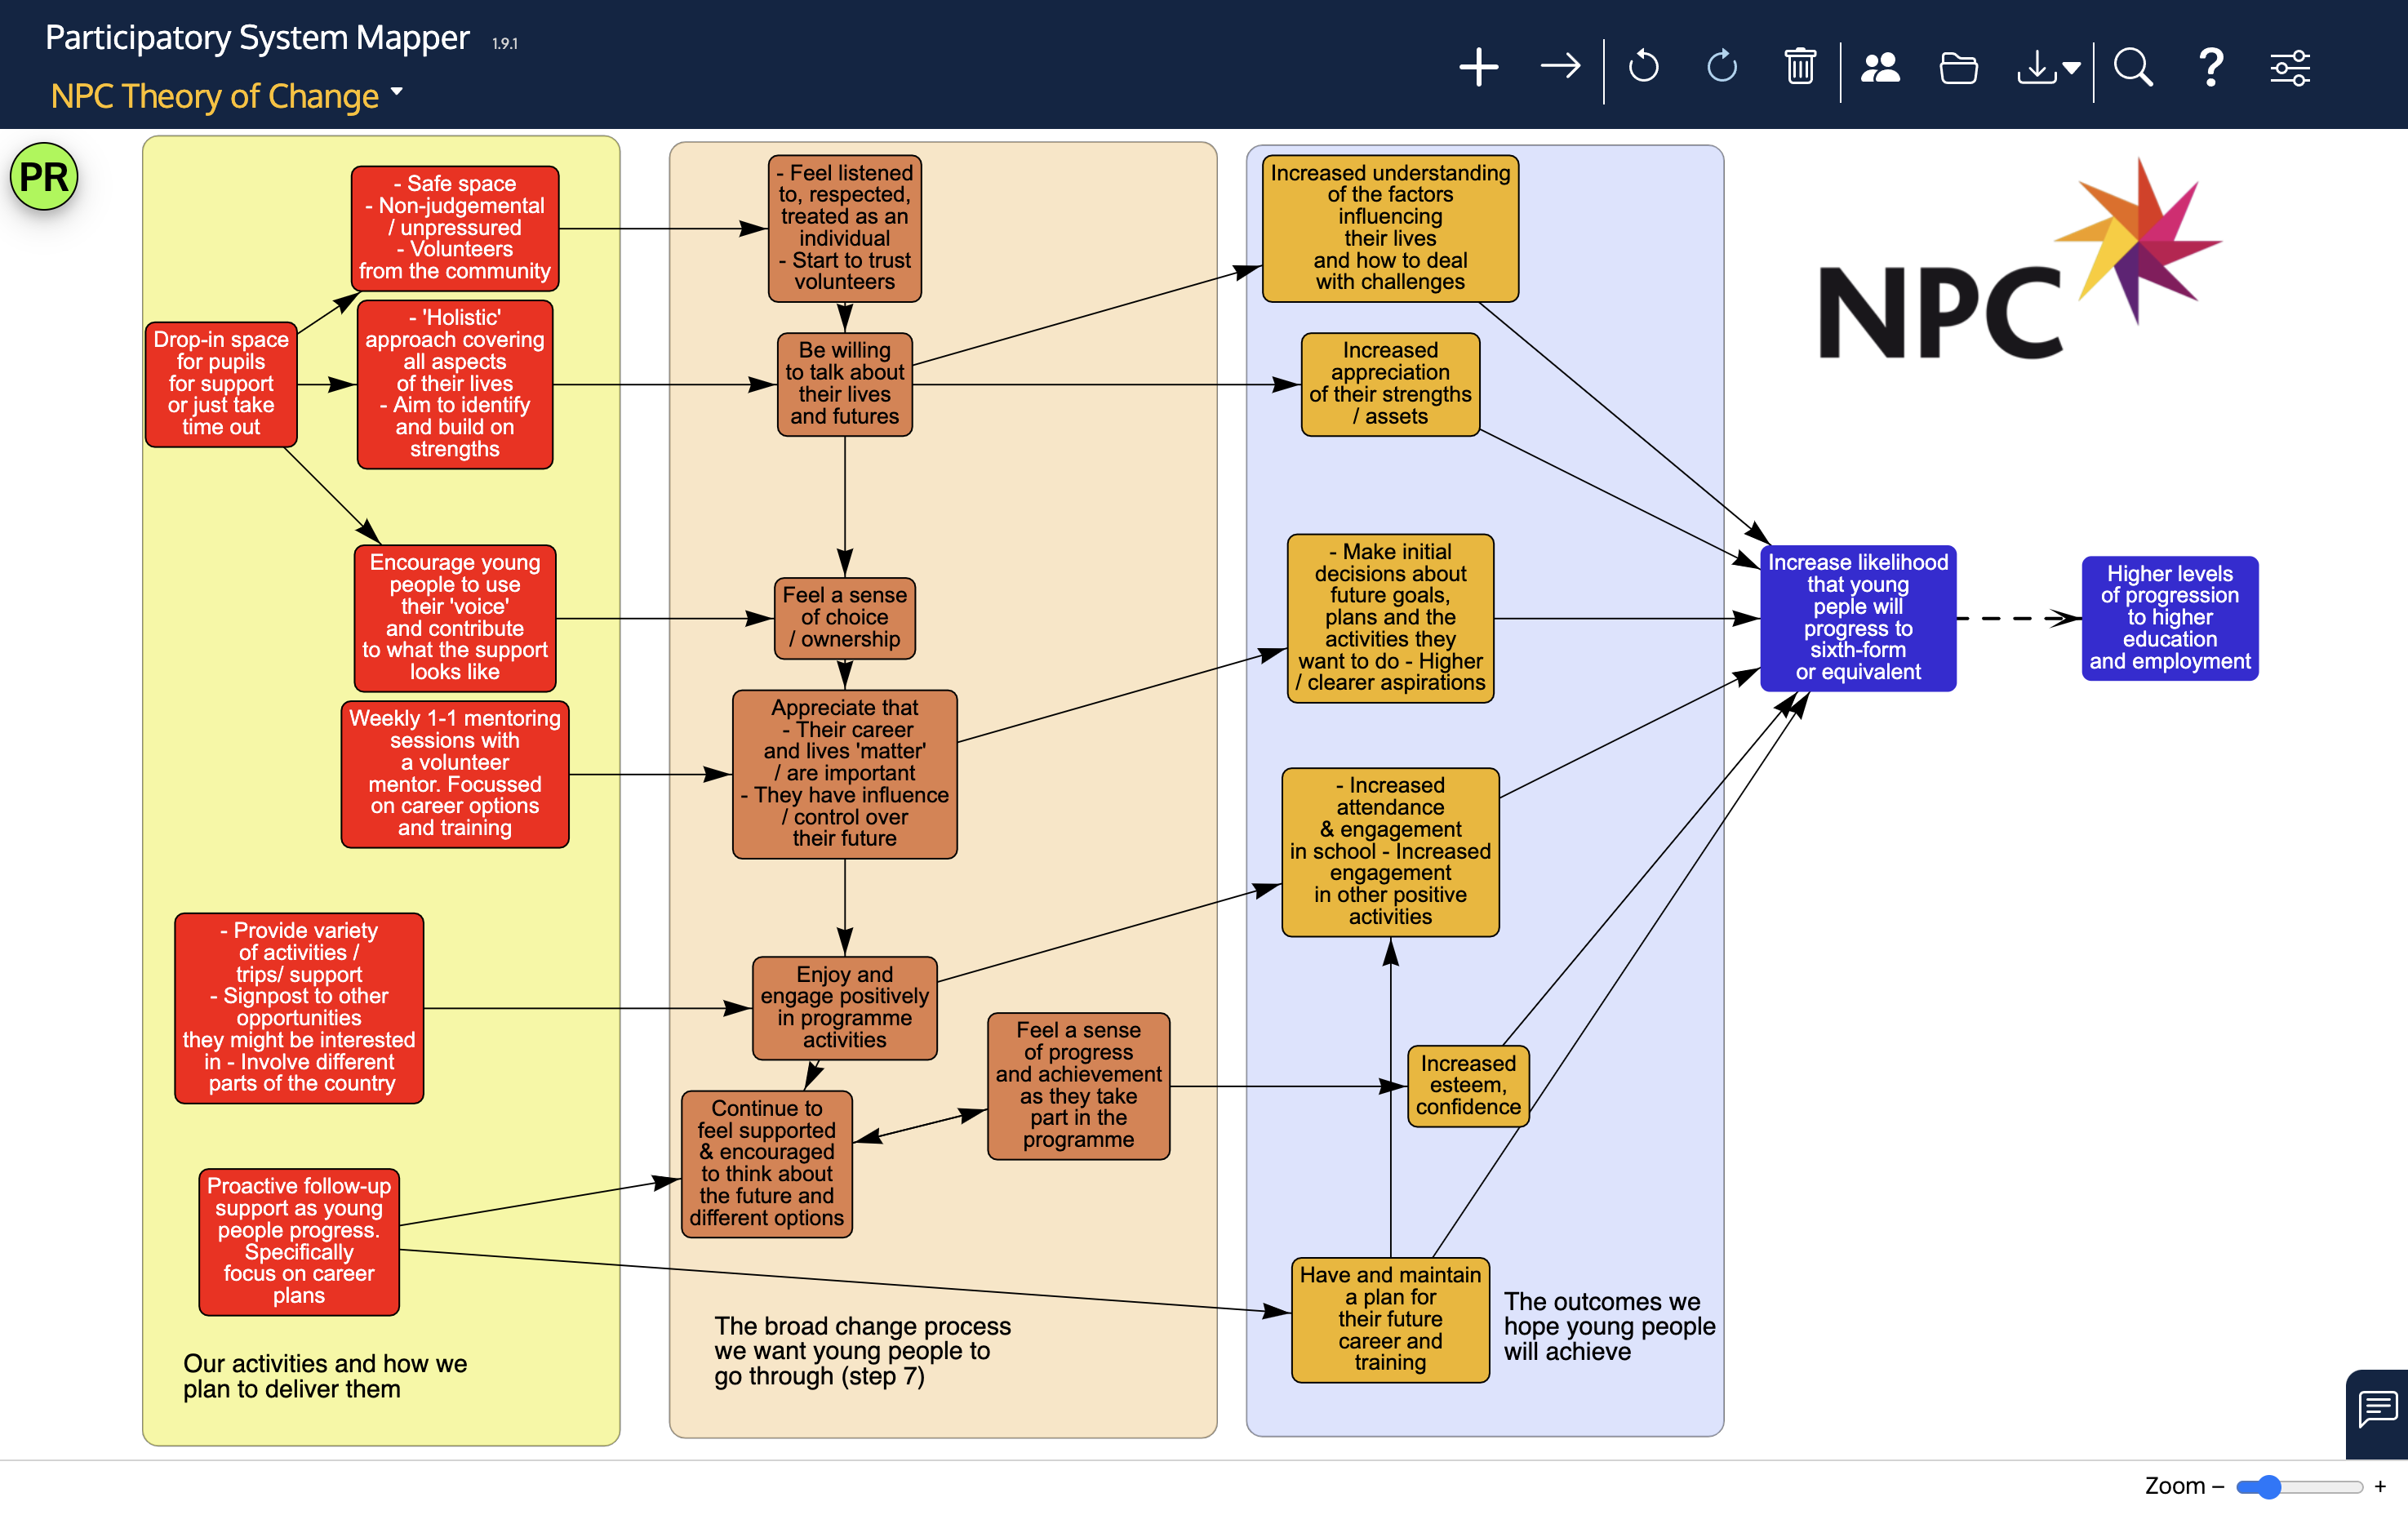
The first is a theory of change adapted from an NPC report.
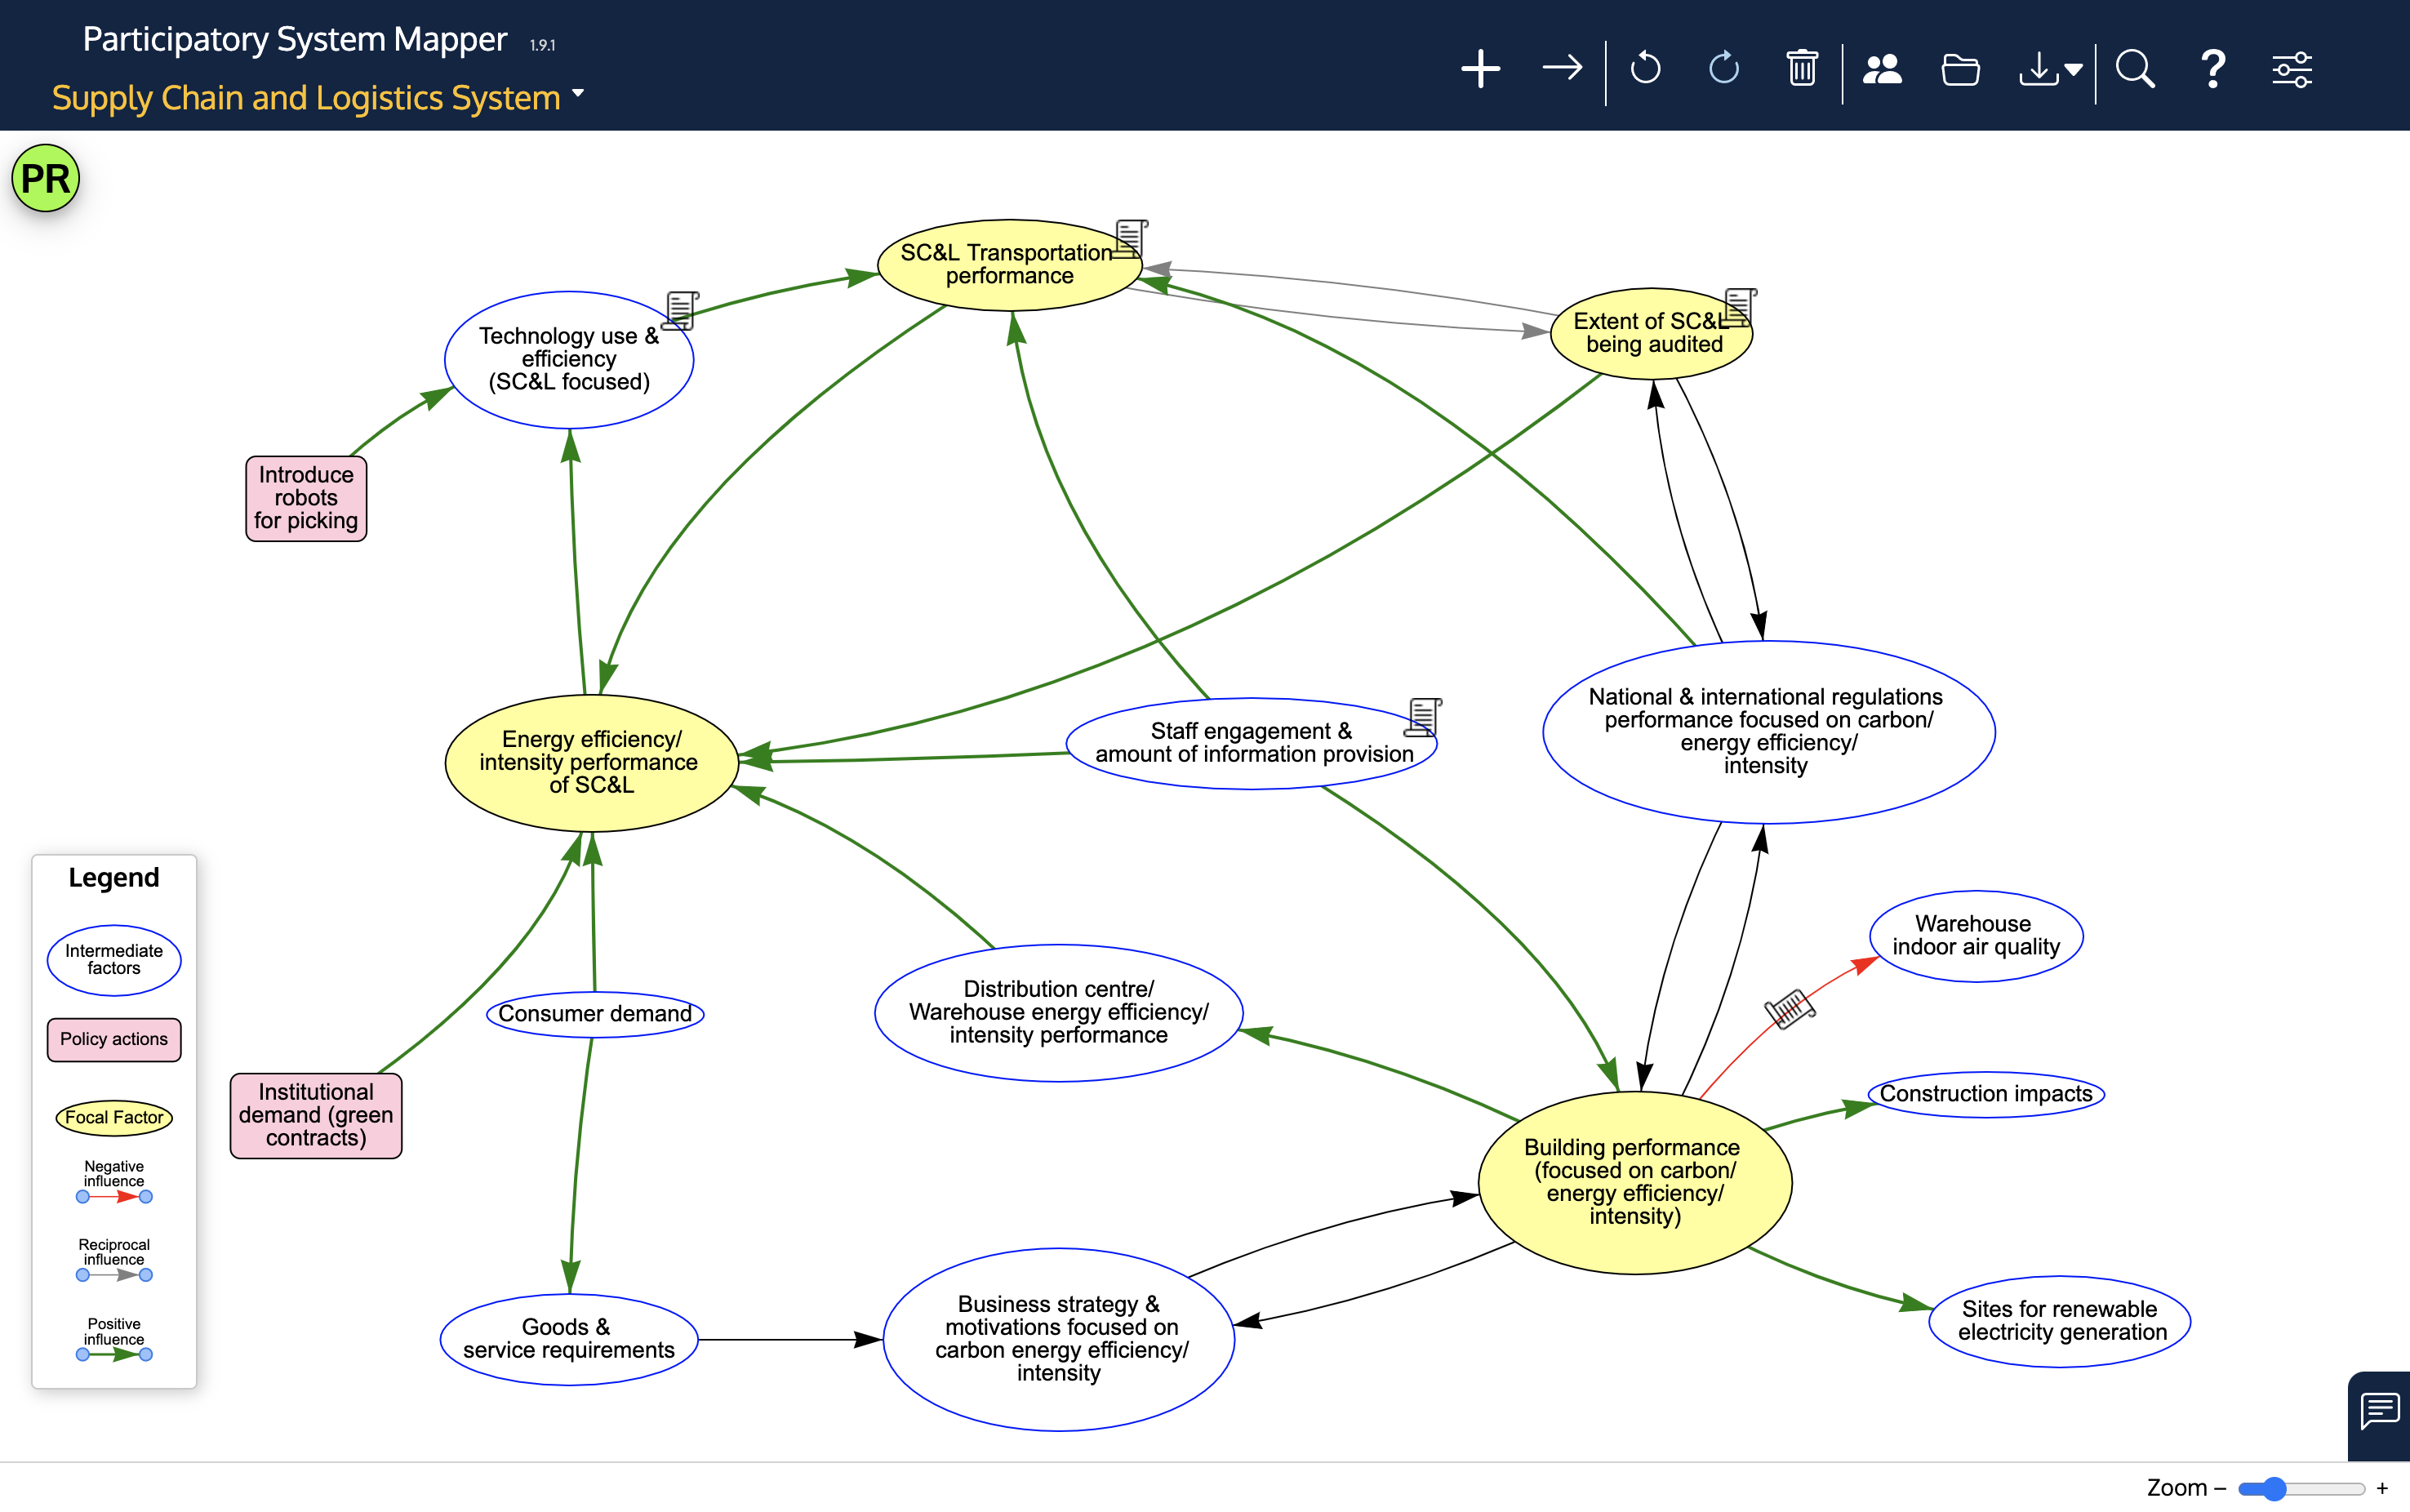
The second is a system map about the environmental impact of goods transport developed by a small group of experts working together using the app.
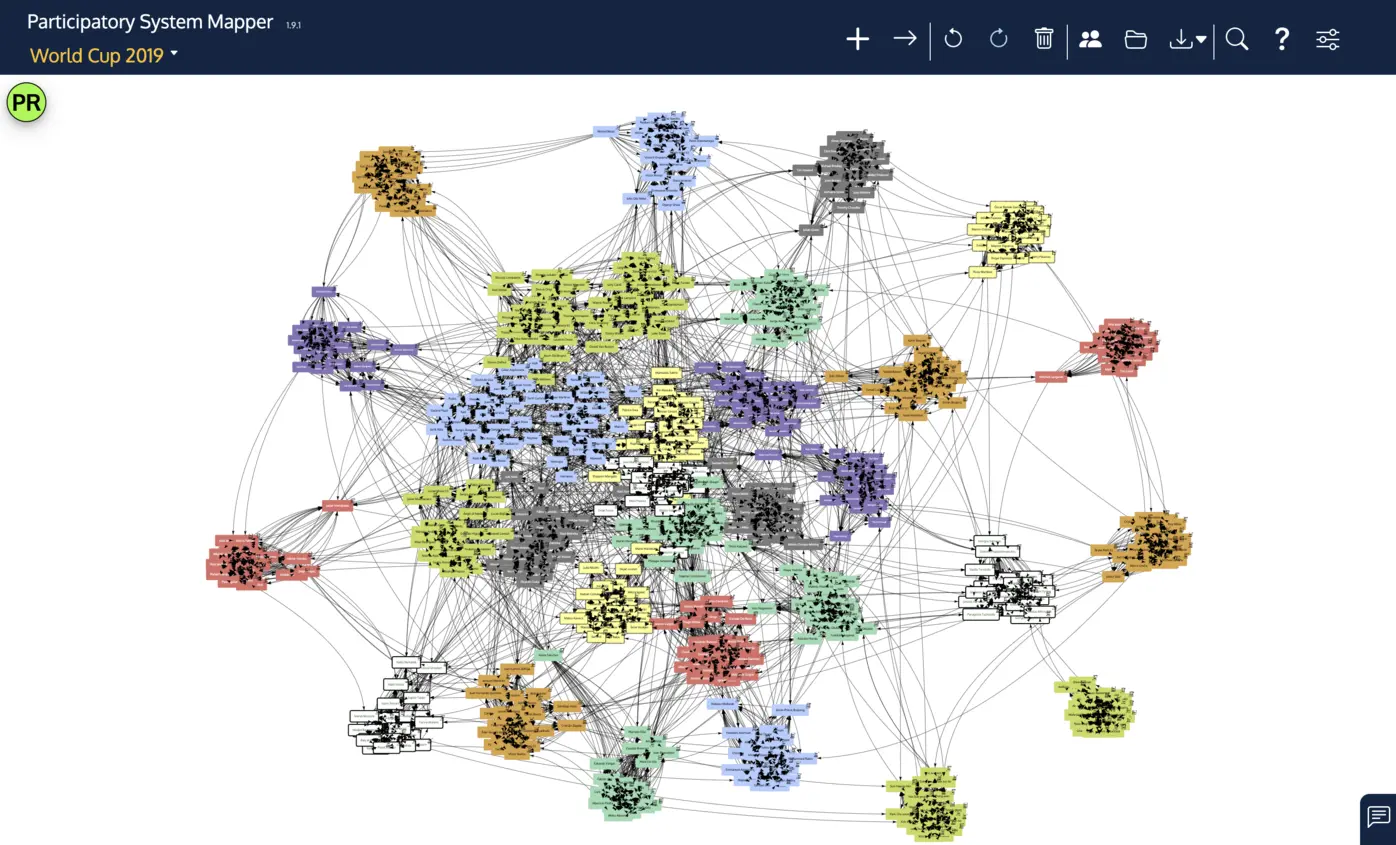
The third is a large network of 736 nodes and about 9000 links representing the team members playing in the 2019 football World Cup.
The fourth is a map of the UK surface transport system focusing on Transport Decarbonisation, Air Quality and Health (see Penn, A. S., Bartington, S. E., Moller, S. J., Hamilton, I., Levine, J. G., Hatcher, K., & Gilbert, N. (2022). Adopting a Whole Systems Approach to Transport Decarbonisation, Air Quality and Health: An Online Participatory Systems Mapping Case Study in the UK. Atmosphere, 13(3), Article 3. https://doi.org/10.3390/atmos13030492)
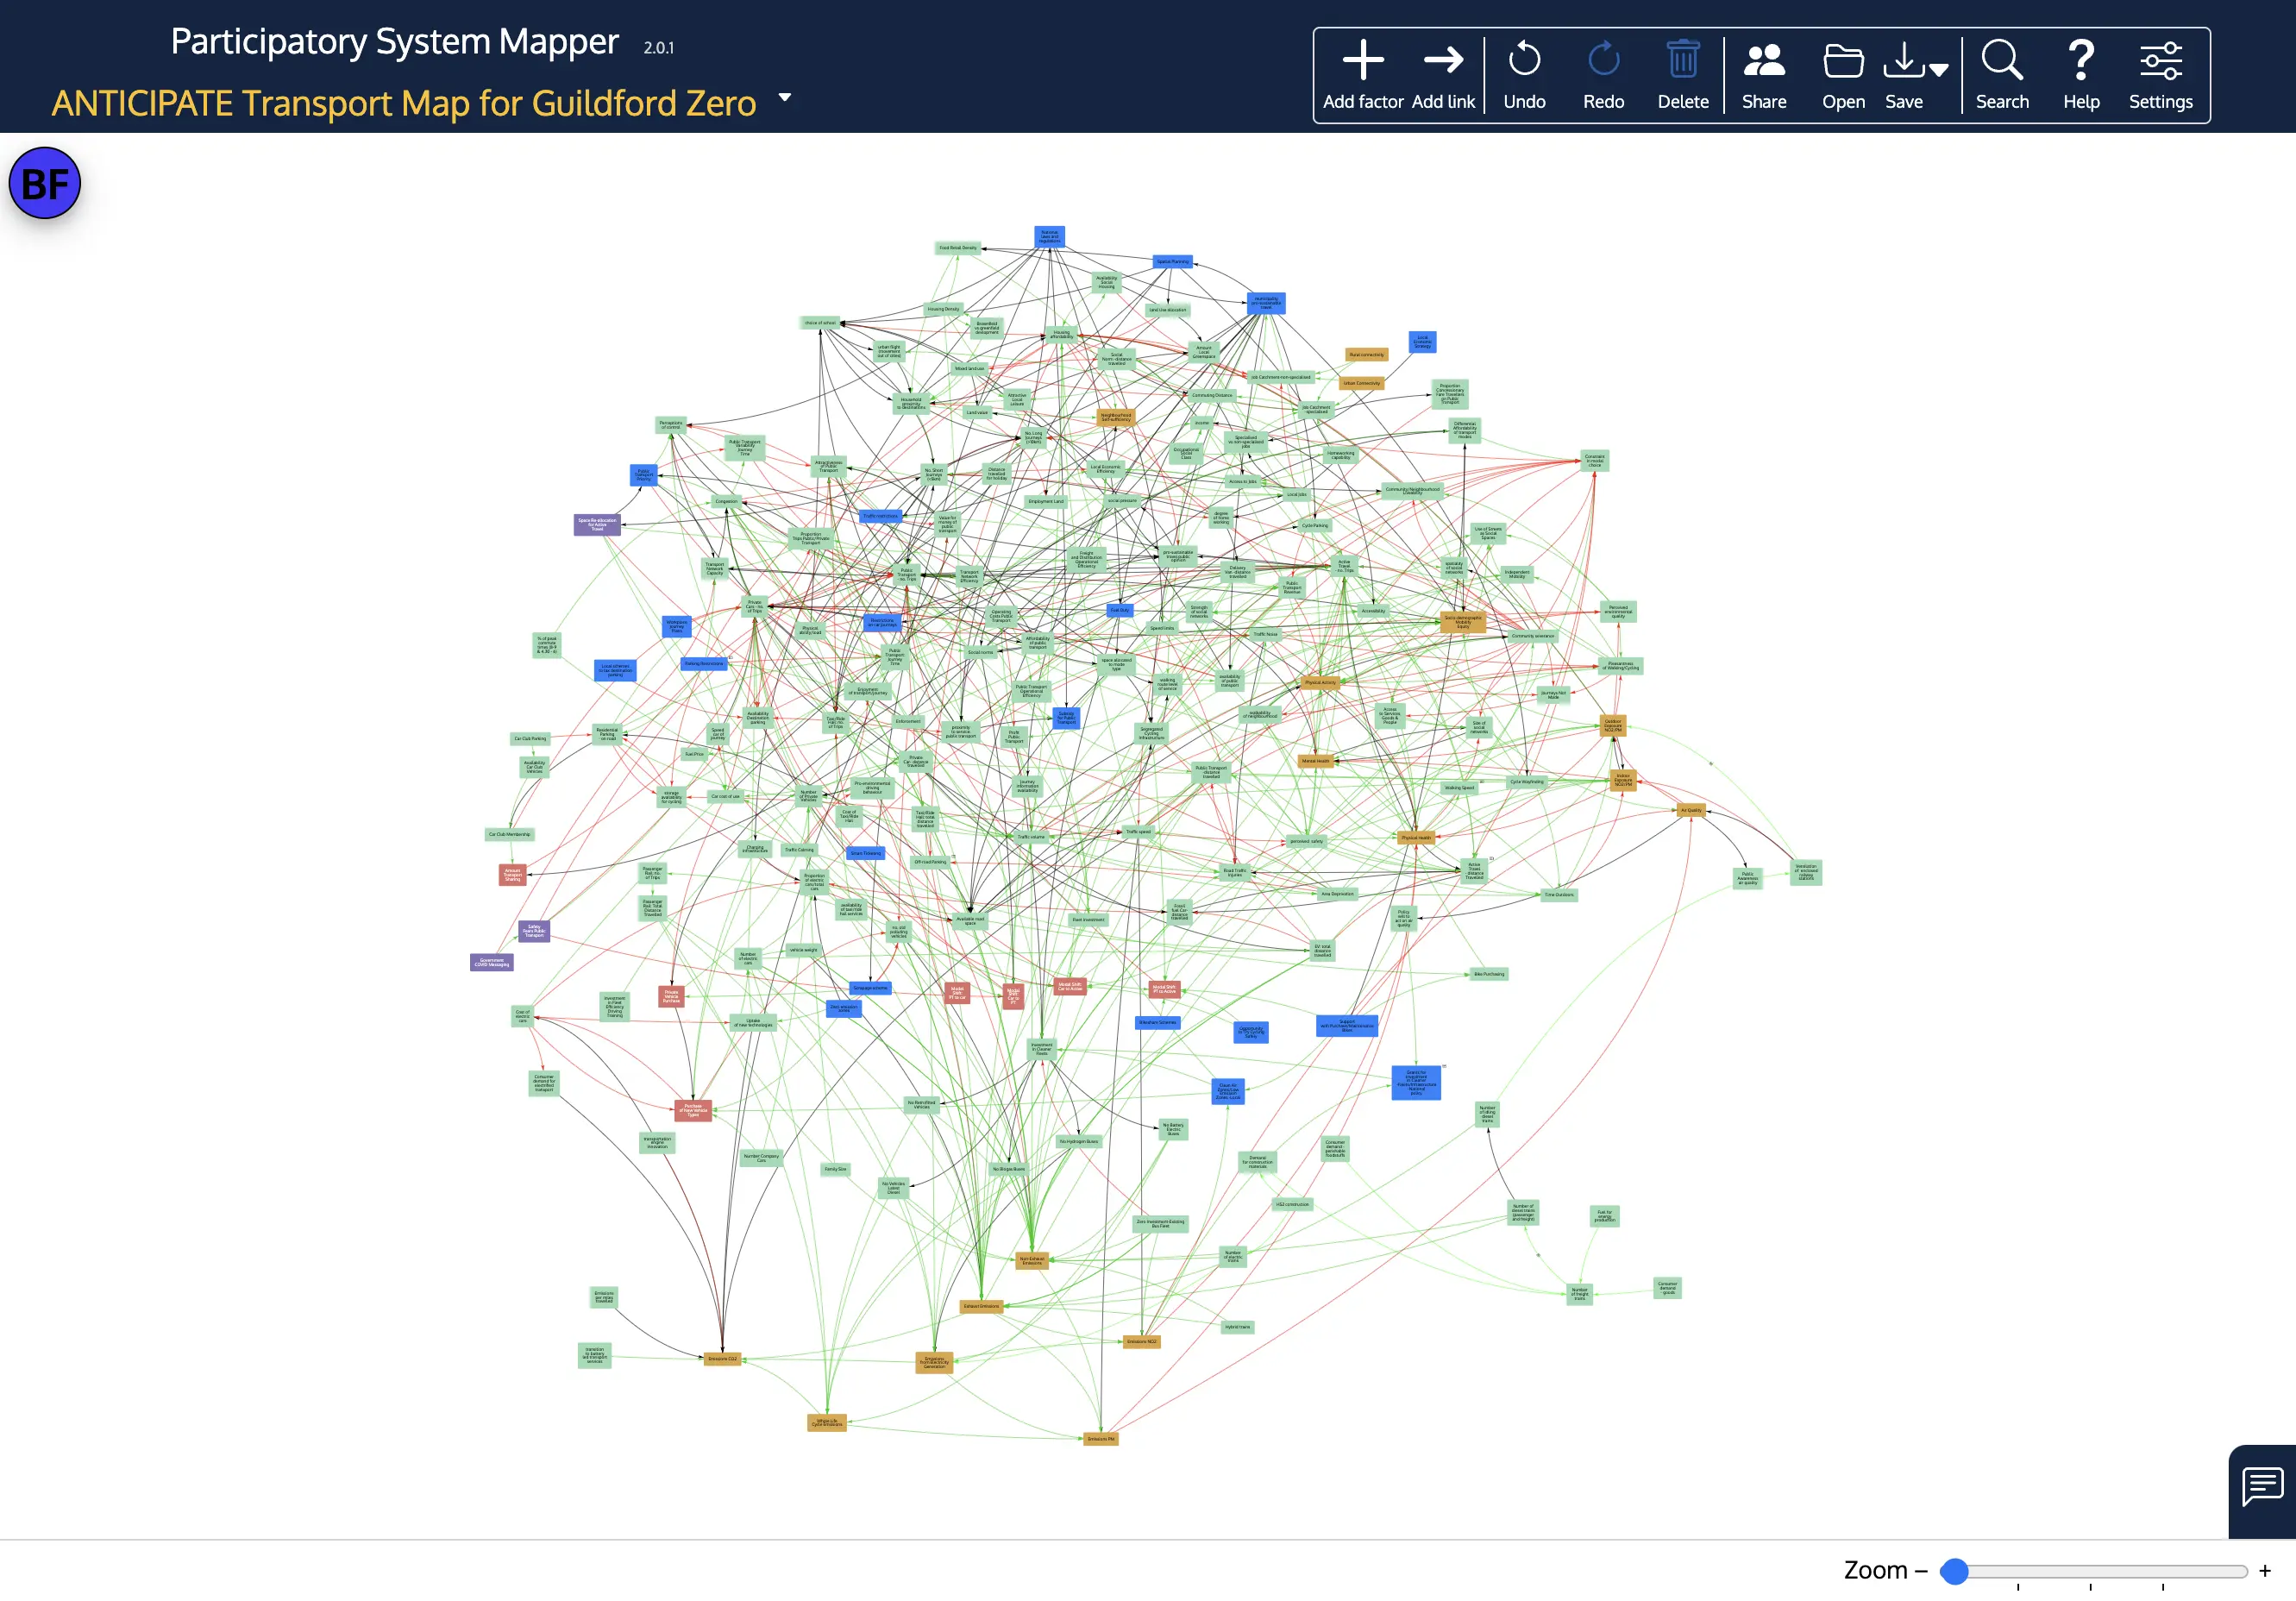
and an extract from that map showing the impications of changing the number of electric cars.
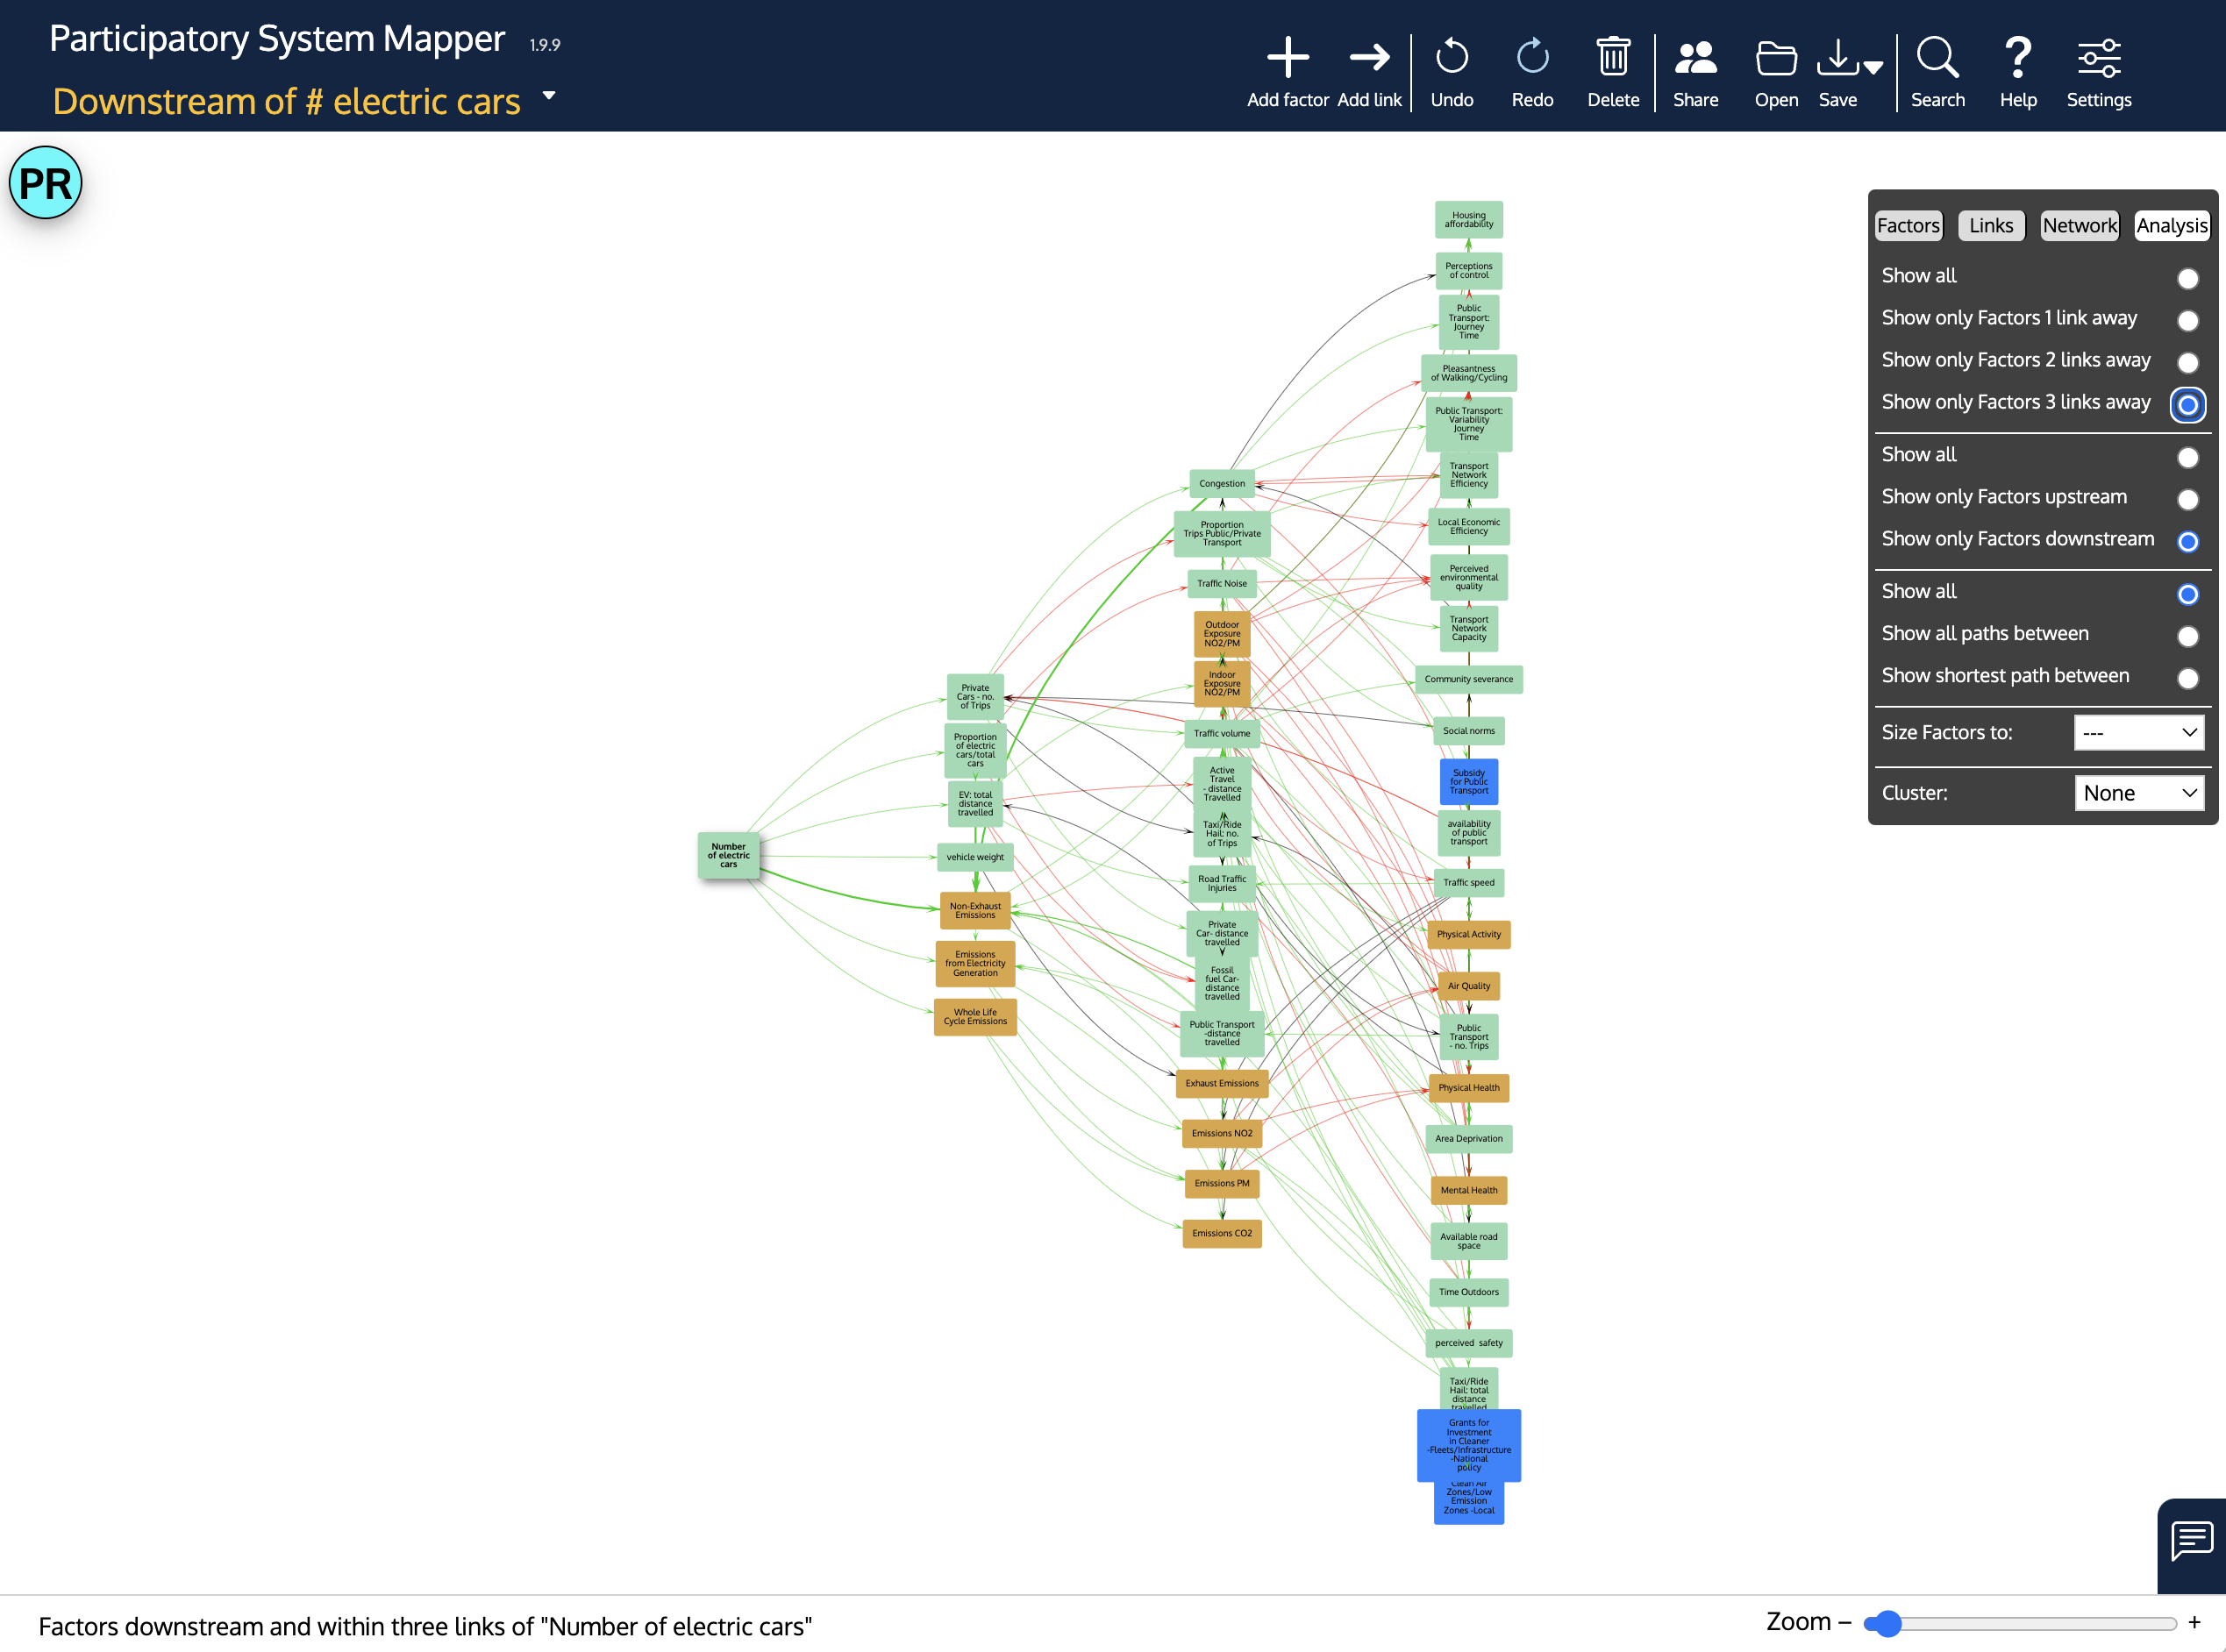
This uses some of the PRSM analysis and layout functions: Show only factors 3 links from the selected factor; Show links downstream of the selected factor; and the Fan layout.